
A news/videos recommendation engine driven by collaborative reader behavior
Reading the news online has exploded as the web provides access to millions of news sources from around the world. The sheer volume of articles can be overwhelming to readers. Therefore, building a news recommendation system to help users find articles that are most interesting to them is a crucial task for every online news service.
News recommendation systems must be able to handle the challenge of fresh content: breaking news that hasn’t yet been viewed by many readers. Thus we need to leverage the data associated with the article content available at time of publishing — such as topics, categories, and tags — to build a content-based model, and match it to readers’ interests learned from their reading histories. However, one drawback of content–based recommendations is that when there is insufficient user history, the coverage of the recommendations is very limited. This is referred to as the cold-start problem, common in recommender systems.
OUR APPROACH
To cater all these challenges, we introduces a news recommendation engine which combines collaborative-filtering with content-based filtering to diversify news recommendations. This so-called Hybrid Filtering Recommendation System takes into account not only the content of the articles and the user’s reading history, but also the reading history of people who share similar interests. By learning from the history of people with similar interests, this engine will recommend news with a broader coverage of topics, even when the historical information about a particular user is limited.
We not only computed a user profile based on the content consumed and defined a neighbourhood for the user but also computed a profile for the “Average Joe” – effectively a profile that reflects composite consumption across the user base. To recommend items, we balance the users own signal with that from his neighbourhood and that from Average Joe, with weights that reflect the current state of consumption signal of the User – effectively a personalized approach to personalization.
TECHNIQUES, TECHNOLOGIES, TOOLS
Topic Modeling, Content based filtering, Collaborative filtering, Implicit ratings, Named Entity Extraction, Part of Speech Tagging, Elastic Search, Kafka.
METHODOLOGY
In this post, we’ll explain how we built the recommendation engine from the ground up.
- Step 1: Finding readers with similar interests
- Step 2: Topic modeling
- Step 3: Making recommendations
- Step 4: Evaluation of the recommender
Step 1: Finding readers with similar interests
As a first step, the engine identifies readers with similar news interests based on their behavior of reading articles posted on news website. We captured user clickstream data including what article is being liked, what article is being shared. By looking at how many news posts two users share in common, we can define a cosine similarity score for the users. This similarity score enables the construction of a network by weighting the links between users.
By applying a clustering hierarchical algorithm to the user network, I can detect the community structures among the readers. The hierarchical clustering algorithm uses a greedy method to try and optimize the modularity of clusters (defined below). The modularity is an important metric for network clustering, which indicates how dense the connections within clusters are compared to the connections between different clusters.
 Modularity score of a clustering in networks.
In the equation, m is the total number of links in a network, v and w are indices of the nodes in the network (users), A is the link matrix between each pair of nodes (defined as the similarity score), kv is the total link weight that is connected to a specific node v, and cv is the group label of node v.
Any real-world network will have a modularity value between 0 and 1. In our user network, the modularity score of the hierarchical clustering algorithm peaks at 6 clusters with value 0.151.
 Community structure in the user network detected from the clustering algorithm.
Each point represents a user, with colors representing their group label. The length of links between users are inversely related to the similarity between them. More similar users will be pulled closely together while dissimilar users will be pushed further apart.
In the graph, users with high similarities are pulled closer to each other and less similar users will be pushed further apart. Some groups (for example the red, purple, green and light blue groups) show a very tight structure with extremely high similarities within the group, while the other groups are in a more diffuse shape, indicating more diverse interests among the group members.
Now that we’ve identified several user groups with high similarities, but how do we know what kind of news they like to read?
Step 2: Topic modeling
In order to understand the content that users like to read, we used a natural language processing technique called Latent Dirichlet Allocation (LDA) that allows to identify hidden topics of documents based on the co-occurrence of words collected from those documents. LDA can also be used to understand how much of an article is devoted to a particular topic, which allows the system to categorize an article, for instance, as 50% environment and 40% politics.
The following figure shows the probability distributions of all the articles among the 20 topics learned from LDA model. There are several hot topics with high probability among all the articles we collected, which include politics, finance, technology, environment, etc.
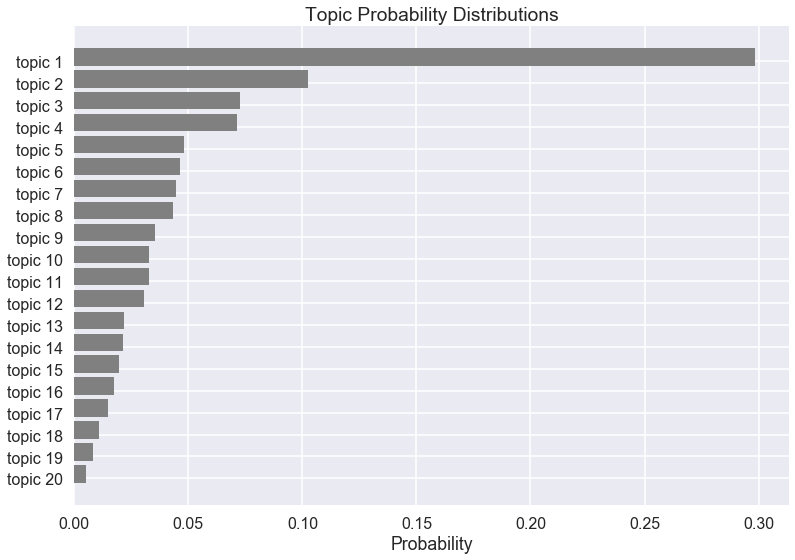 Topic distribution among 20 topics learned from LDA in all the articles. Topics with high probability are about politics (1), finance (2), technology (3), and environment (4).
With the topic information of each article, we can learn the topic interests of each user group by summarizing the topics of the popular articles in each reader group.
Another way to visualize the different topic distributions is by looking at the keywords in each group. Here we show two examples of user group 0 (blue in the network) and user group 3 (green).
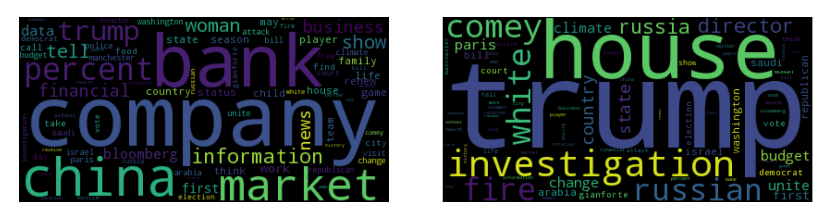 Word clouds generated from the topic distributions of different user groups. Here we show two examples, group 0 (left) which has more interests on finance, and group 3 (right) with more focused interest on politics.
Step 3: Making recommendations
Now that we have divided the users into different groups based on their similarity and identified their interests among different topics, the next step is to recommend fresh news by matching the topics of the article with the topic profile of each user group. In other words, our recommendation engine doesn’t provide personalized recommendations solely based on a particular user’s interest, but instead gives group-based recommendations in order to obtain a more diverse result.
When recommending new articles to a user group, we want to find articles that have the most similar topics with the group’s interests. The similarity between each new article and the group is calculated as the cosine similarity of their topic distributions.

Demonstration of the cosine similarity between each article and the user groups.
By ranking the articles by similarity score, the best-matching articles will be recommended to all of the readers within the reader group.
Step 4: Evaluation of the recommender
Great! The recommender seems to be working, but how do we know whether it is working well? How much will the readers like the recommendations that they get? The evaluation of a recommending system can be quite tricky. The golden metric for a recommending system is how much the system will add value to the user and business. Ultimately, you want to perform A/B testing to see whether recommendations will increase usage, subscriptions, clicks, etc.
However, in practice there are other common metrics to evaluate a recommender, which can still help us gain some insights on the performance before actually putting the system into use. Most of these offline methods require hold-out subset of the training data (in this case, holding out a subset of previously retweeted news posts), pretending the users haven’t seen these items and trying to recommend them back to the users. Since the reader groups’ history about this test set already exists, we can leverage this information to validate the performance of recommender.
One natural goal of recommender systems is to distinguish good recommendations from bad ones. In the binary case, this is very natural — a “1” is a good recommendation, while “0” means a bad recommendation. However, since the data that we have (number of retweets of an article by users from a user group) is non-binary, a threshold must be chosen such that all ratings above the threshold are good and called “1”, while the rest are bad with label “0”. A natural way to set the threshold is to choose the median value of the number of retweets in a user group, labeling all of the articles above the median as “good” recommendations and all the rest as “bad”. The predicted score from the recommending system is the cosine similarity between the topics of an article and the topics in a user group, which ranges from 0 to 1.
The choice of the threshold can be varied depending on desired tradeoffs. Therefore to summarize classification performance generally, we need metrics that can provide summaries over this threshold. One tool for generating such a metric is the Receiver Operator Characteristic (ROC) curve, which plots the True Positive Rate (TPR) versus the False Positive Rate (FPR) at different threshold levels. The area under the curve (often referred to as the AUC) indicates the probability that a classifier will rank a randomly chosen positive instance higher than a randomly chosen negative one, which can provide some insight on the predictive power of our model.
RESULT/IMPACT
The recommendation system continues to learn and adapt automatically as it sees what the users are viewing. This ongoing improvement through machine learning enables us to understand what the user wants and ensures that the recommendations always reflect what the readers are interested in leading to a significant increase user stickiness because of a more personalized customer experience.
SUMMARY, and WHAT’S NEXT
The framework of this recommendation engine is quite versatile: it can be adapted to combine data from different platforms (Twitter, Facebook, news websites) to construct the user network; if combined with more personal information from the users, the system can also be developed to analyze user behavior and improve marketing and advertising decisions.